You are going to go through Statistics Chapter 14 Extra Questions and Solutions For Class 10 CBSE Mathematics. This post presents to the students a clear conception of how to move with the basics of Extra Questions and answers. The expert prepared The Extra Questions and And Answers. https://cbsencertanswers.com/is very much to make things way simpler and easier for the students. Especially those who are appearing for the board exams. We took every care to make sure that the effort serves the purpose. So, let us find out Statistics Chapter 14 Extra Questions and Solutions For Class 10 CBSE Mathematics. On this page, you can find Statistics Chapter 14 Extra Questions and Solutions For Class 10 CBSE Mathematics.
1 . Find the mean of the following distribution:
| X : | 19 | 21 | 23 | 25 | 27 | 29 | 31 |
| F: | 13 | 15 | 16 | 18 | 16 | 15 | 13 |
Solution.
| X | F | FX |
| 19 | 13 | 247 |
| 21 | 15 | 315 |
| 23 | 16 | 368 |
| 25 | 18 | 450 |
| 27 | 16 | 432 |
| 29 | 15 | 435 |
| 31 | 13 | 403 |
| N = 106 | Σ FX = 2620 |
MEAN = Σ FX / N = 2620 / 106 = 25
Therefore, Mean is 25.
2 . If the mean of the following is 20.6 , find value if p ?
| X | 10 | 15 | p | 25 | 35 |
| F | 3 | 10 | 25 | 7 | 5 |
Solution.
| X | F | FX |
| 10 | 3 | 30 |
| 15 | 10 | 150 |
| p | 25 | 25p |
| 25 | 7 | 175 |
| 35 | 5 | 175 |
| N : 50 | Σ FX : 530 + 25p |
Now,
Mean = Σ FX / N = ( 530 + 25p ) / 50
It is given that mean is 20.6 ,
20.6 = ( 530 + 25p ) / 50
( 20.6 * 50 ) = 530 + 25p
P = 500 / 25 = 20
Therefore, the value of p is 20.
YOU ARE READING: Statistics Chapter 14 Extra Questions For Class 10 CBSE Mathematics
3. If the mean of the following is 15 , find value of p i.e. the missing frequency ?
| X | 5 | 10 | 15 | 20 | 25 |
| F | 6 | p | 6 | 10 | 5 |
Solution.
| X | F | FX |
| 5 | 6 | 30 |
| 10 | p | 10p |
| 15 | 6 | 90 |
| 20 | 10 | 200 |
| 25 | 5 | 125 |
| N: p+27 | Σ FX : 445 + 10p |
Mean = Σ FX / N = ( 445 + 10p) / ( p + 27)
Now, Mean = 15
Mean = (445 + 10p) / ( p + 27 )
15 = (445 + 10p)/( p+ 27)
15p + 405 = 445 + 10p
5p = 40
p = 8.
So, the value of the following missing frequency p is 8.
4 . Mean is 12.58 of the respective, find the value of p ?
| X | 5 | 8 | 10 | 12 | p | 20 | 25 |
| F | 2 | 5 | 8 | 22 | 7 | 4 | 2 |
Solution.
| X | F | FX |
| 5 | 2 | 10 |
| 8 | 5 | 40 |
| 10 | 8 | 80 |
| 12 | 22 | 264 |
| p | 7 | 7p |
| 20 | 4 | 80 |
| 25 | 2 | 50 |
| N : 50 | Σ FX = 524 + 7p |
And , Mean = Σ FX / N = ( 524 + 7p) / 50
Mean = 12.58,
12.58 = ( 524 + 7p) / 50
12.58 * 50 = 524 + 7p
629 – 524 = 7p
7p = 105
p = 15
So, the value of p is 15 .
YOU ARE READING: Statistics Chapter 14 Extra Questions For Class 10 CBSE Mathematics
5. Find missing frequency p , where mean of distribution is 7.68 ?
| X | 3 | 5 | 7 | 9 | 11 | 13 |
| F | 6 | 8 | 15 | p | 8 | 4 |
Solution.
| X | F | FX |
| 3 | 6 | 18 |
| 5 | 8 | 40 |
| 7 | 15 | 105 |
| 9 | p | 9p |
| 11 | 8 | 88 |
| 13 | 4 | 52 |
| N : 41 + p | Σ FX : 303 + 9p |
Mean = Σ FX / N = ( 303 + 9p) / (41 + p)
Here, mean = 7.68
7.68 = (303 + 9p)/(41 + p)
1.32p = 11.88
p= 9
Therefore, the value of p is 9 whose mean is 7.68.
6. The number of telephone calls received at an exchange per interval for 250 successive one- minute intervals are given in the following frequency table:
| CALLS (X) | 0 | 1 | 2 | 3 | 4 | 5 | 6 |
| INTERVALS(F) | 15 | 24 | 29 | 46 | 54 | 43 | 39 |
Compute the mean number of calls per interval ?
Solution.
Let the assumed mean (A) is 3
| X | F | U = X -A | FU |
| 0 | 15 | -3 | -45 |
| 1 | 24 | -2 | -48 |
| 2 | 29 | -1 | -29 |
| 3 | 46 | 0 | 0 |
| 4 | 54 | 1 | 54 |
| 5 | 43 | 2 | 86 |
| 6 | 39 | 3 | 117 |
| N : 250 | Σ FU : 135 |
Mean number of calls = A + (Σ FU/ N)
= 3 + ( 135 / 250 )
= 885 / 250
= 3.54
So, the mean number of calls per interval is 3.54 .
7. The following table gives the number of branches and number of plants in the garden of a school.
| Branches (X) | 2 | 3 | 4 | 5 | 6 |
| Plants ( F) | 49 | 43 | 57 | 38 | 13 |
Compute the average number of branches per plant?
Solution.
Let the assumed mean (A) is 4
| X | F | U= X – A | FU |
| 2 | 49 | -2 | -98 |
| 3 | 43 | -1 | -43 |
| 4 | 57 | 0 | 0 |
| 5 | 38 | 1 | 38 |
| 6 | 13 | 2 | 26 |
| N: 200 | Σ FU : -77 |
Average no of branches per plant = A + (Σ FU/N)
= 4 – 77/200 = (800 – 77)/200 = 3.615
So, the average number of branches per plant is 3.615.
YOU ARE READING: Statistics Chapter 14 Extra Questions For Class 10 CBSE Mathematics
8. The following table gives the distribution of total household expenditure (in rupees) of manual workers in a city. Find the average expenditure (in rupees) per household?
| Expenditure X : | Frequency F : | Expenditure X: | Frequency F: |
| 100 – 150 | 24 | 300 – 350 | 30 |
| 150 – 200 | 40 | 350 – 400 | 22 |
| 200 – 250 | 33 | 400 – 450 | 16 |
| 250 – 300 | 28 | 450 – 500 | 7 |
Solution.
Let assumed mean (A) is 275
| Class interval | mid value X | D = X – A | U =(X-275)/50 | Frequency F | FU |
| 100 – 150 | 125 | -150 | -3 | 24 | -72 |
| 150 -200 | 175 | -100 | -2 | 40 | -80 |
| 200 – 250 | 225 | -50 | -1 | 33 | -33 |
| 250 – 300 | 275 | 0 | 0 | 28 | 0 |
| 300 – 350 | 325 | 50 | 1 | 30 | 30 |
| 350 – 400 | 375 | 100 | 2 | 22 | 44 |
| 400 – 450 | 425 | 150 | 3 | 16 | 48 |
| 450 – 500 | 475 | 200 | 4 | 7 | 28 |
| N: 200 | Σ FU = -35 |
A = 275 and h =50
Mean = A + h * (Σ FU / N)
= 275 + 50 * ( -35 /200)
= 266.25
9. A survey was conducted by a group of students as a part of project regarding the number of plants in 200 houses in a locality. Find the mean number of plants per house.Which method did you use for finding the mean, and why?
| Plants | 0-2 | 2 – 4 | 4 – 6 | 6 – 8 | 8- 10 | 10 -12 | 12 -14 |
| House | 1 | 2 | 1 | 5 | 6 | 2 | 3 |
Solution.
From the given data we have to find the class interval we know that,
Class marks (x) = (upper class limit + lower class limit)/2
| Plants | Houses | X | FX |
| 0-2 | 1 | 1 | 1 |
| 2-4 | 2 | 3 | 6 |
| 4-6 | 1 | 5 | 5 |
| 6-8 | 5 | 7 | 35 |
| 8- 10 | 6 | 9 | 54 |
| 10 -12 | 2 | 11 | 22 |
| 12 -14 | 3 | 13 | 39 |
| N : 20 | Σ FU = 162 |
Mean = Σ FU / N
= 162 / 20 = 8.1
Thus , the mean number of plant per house is 8.1 . Here we will use the Direct Method as values of class marks X and F are very small.
10. Consider the following distribution of daily wages of workers of a factory.Find the mean daily wages of the workers of the factory by using an appropriate method?
| Daily wages (in ₹) | 100-120 | 120-140 | 140-160 | 160-180 | 180-200 |
| Number of workers: | 12 | 14 | 8 | 6 | 10 |
Solution.
Let the Assumed Mean (A) is 150
| Class interval | Mid value X | D = X -150 | U = (X-150)/20 | F | FU |
| 100-120 | 110 | -40 | -2 | 12 | -24 |
| 120-140 | 130 | -20 | -1 | 14 | -14 |
| 140-160 | 150 | 0 | 0 | 8 | 0 |
| 160 -180 | 170 | 20 | 1 | 6 | 6 |
| 180 – 200 | 190 | 40 | 2 | 10 | 20 |
| N: 50 | Σ FU = -12 |
A = 150 and h = 20
Mean = A + h * (Σ FU /N)
= 150 + 20 * ( -12 /50 )
= 150 – 4.8
= 145.20 .
YOU ARE READING: Statistics Chapter 14 Extra Questions For Class 10 CBSE Mathematics
11. Find the mean of the frequency distribution :
| Class interval | 0-6 | 6-12 | 12-18 | 18-24 | 24-30 |
| frequency | 6 | 8 | 10 | 9 | 7 |
Solution:
Let the Assumed Mean (A) is 15.
| Class interval | Mid value X | D = X – A | U= X- A/ 6 | F | FU |
| 0 -6 | 3 | -12 | -2 | 6 | -12 |
| 6 – 12 | 9 | -6 | -1 | 8 | -8 |
| 12 – 18 | 15 | 0 | 0 | 10 | 0 |
| 18 – 24 | 21 | 6 | 1 | 9 | 9 |
| 24 – 30 | 27 | 12 | 2 | 7 | 14 |
| N : 40 | Σ FU =3 |
Here, A = 15 and h = 6
Mean = A + h x (Σ FU /N)
= 15 + 6 x (3/40) = 15 + 0.45 == 15.45
12. Following are the lives in hours of 15 pieces of the components of aircraft engine. Find the median:
715, 724, 725, 710, 729, 745, 694, 699, 696, 712, 734, 728, 716, 705, 719.
Solution.
Arranging the given data in ascending order, we have
694, 696, 699, 705, 710, 712, 715, 716, 719, 721, 725, 728, 729, 734, 745.
Here the number of terms is an old number i.e., N = 15
We use the following procedure to find the median.
Median = (N + 1)/2 th term
= (15 + 1)/2 th term
= 8th term
So, the 8th term in the arranged order of the given data should be the median.
Therefore, 716 is the median of the data.
13. The following is the distribution of height of students of a certain class in a certain city. Find the median height.
| Height in cm | 160-162 | 163-165 | 166-168 | 169-171 | 172-174 |
| students | 15 | 118 | 142 | 127 | 18 |
Solution.
| Class Interval exclusive | Class Interval inclusive | Class Interval Frequency | Cumulative Frequency |
| 160-162 | 159.5-162.5 | 15 | 15 |
| 163-165 | 162.5-165.5 | 118 | 133 (F) |
| 166-168 | 165.5-168.5 | 142 (f) | 275 |
| 169-171 | 168.5-171.5 | 127 | 402 |
| 172-174 | 171.5-174.5 | 18 | 420 |
| N : 420 |
Here, we have N as 420. The cumulative frequency just greater than N/2 is 275 then 165.5 – 168.5 is the median class. Now,
L = 165.5, f = 142, F = 133 and h = (168.5 – 165.5) = 3
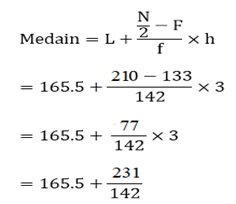
=165.5 + 1.63 = 167.13
Statistics
YOU ARE READING: Statistics Chapter 14 Extra Questions For Class 10 CBSE Mathematics
14. Calculate the median from the following data:
| Marks | 0-10 | 10-20 | 20-30 | 30-40 | 40-50 | 50-60 | 60-70 | 70-80 |
| Students | 15 | 35 | 60 | 84 | 96 | 127 | 198 | 250 |
Solution.
| Marks below | Students | Class Interval | frequency | Cumulative Frequency |
| 10 | 15 | 0-10 | 15 | 15 |
| 20 | 35 | 10-20 | 20 | 35 |
| 30 | 60 | 20-30 | 25 | 60 |
| 40 | 84 | 30-40 | 24 | 84 |
| 50 | 96 | 40-50 | 12 | 96 |
| 60 | 127 | 50-60 | 31 | 127 |
| 70 | 198 | 60-70 | 71 | 198 |
| 80 | 250 | 70-80 | 52 | 250 |
| N: 250 |
Here , N = 250 so, N/2 = 125.
The cumulative frequency just greater than N/ 2 is 127 then median class is 50 – 60 such that L = 50, f = 31, F = 96, h = 60 -50 = 10
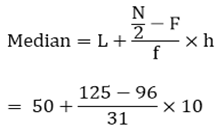
= 50 + 9.35 = 59.35
15. Calculate the missing frequency from the following distribution, it being given that the median of the distribution is 24?
| Age in years | 0-10 | 10-20 | 20-30 | 30-40 | 40-50 |
| No of persons | 5 | 25 | ? | 18 | 7 |
Solution.
Let the unknown frequency be x.
| Class Interval | Frequency | Cumulative Frequency |
| 0-10 | 5 | 5 |
| 10-20 | 25 | 30 (F) |
| 20-30 | x (f) | 30 +x |
| 30-40 | 18 | 48 + x |
| 40-50 | 7 | 55 + x |
| N : 170 |
Given, median = 24.
Then, median class = 20 – 30; L = 20, h = 30 -20 = 10, f = x, F = 30
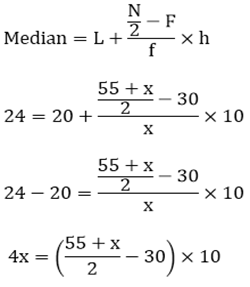
4x = 275 + 5x – 300
4x – 5x = – 25
– x = – 25
x = 25
Therefore, the Missing frequency is 25 where the median is given as 24.
16. The following table gives the distribution of the life time of 400 neon lamps.Find the median life?
| Life Time : in hours | Number of Lamps |
| 1500-2000 | 14 |
| 2000-2500 | 56 |
| 2500-3000 | 60 |
| 3000-3500 | 86 |
| 3500-4000 | 74 |
| 4000-4500 | 62 |
| 4500-5000 | 48 |
Solution.
| Life time in hours | Number of lamps F | Cumulative Frequency CF |
| 1500-2000 | 14 | 14 |
| 2000-2500 | 56 | 70 |
| 2500-3000 | 60 | 130 (CF) |
| 3000-3500 | 86 (F) | 216 |
| 3500-4000 | 74 | 290 |
| 4000-4500 | 62 | 352 |
| 4500-5000 | 48 | 400 |
| N: 400 |
It’s seen that, the cumulative frequency just greater than n/2 (400/2 = 200) is 216 and it belongs to the class interval 3000 – 3500 which becomes the Median class = 3000 – 3500. Frequency (F) of median class = 86 and Cumulative frequency (CF) of class preceding median class = 130 and, the Class size (h) = 500.
We use the following formula to solve it:
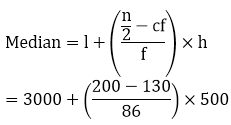
= 3406.98
Therefore, the median lifetime of lamp is 3406.98 hours.
Statistics
YOU ARE READING: Statistics Chapter 14 Extra Questions For Class 10 CBSE Mathematics
17. Find the missing frequencies for the following distribution if the mean is 1.46?
| No of accidents: | 0 | 1 | 2 | 3 | 4 | 5 | Total |
| Frequency No of days : | 46 | ? | ? | 25 | 10 | 5 | 200 |
Solution:
| No of Accidents (X) | No of Days (F) | FX |
| 0 | 46 | 0 |
| 1 | x | x |
| 2 | y | 2y |
| 3 | 25 | 75 |
| 4 | 10 | 40 |
| 5 | 5 | 25 |
| N : 200 | Sum : x + 2y + 140 |
It’s given that, N = 200,Therefore
⇒ 46 + x + y + 25 + 10 + 5 = 200
⇒ x + y = 200 – 46 – 25 – 10 – 5
⇒ x + y = 114 —- (i)
And also given, Mean = 1.46
⇒ Sum/ N = 1.46
⇒ (x + 2y + 140)/ 200 = 1.46
⇒ x + 2y = 292 – 140
⇒ x + 2y = 152 —- (ii)
Subtract equation (i) from equation (ii), we get
x + 2y – x – y = 152 – 114
⇒ y = 38
Now, on putting the value of y in equation (i), we find x = 114 – 38 = 76
Therefore, the missing frequencies are 76 and 38 .
Statistics
18. Find the mode of the following data:
(i) 3, 5, 7, 4, 5, 3, 5, 6, 8, 9, 5, 3, 5, 3, 6, 9, 7, 4
(ii) 15, 8, 26, 25, 24, 15, 18, 20, 24, 15, 19, 15
Solution.
(i) 3, 5, 7, 4, 5, 3, 5, 6, 8, 9, 5, 3, 5, 3, 6, 9, 7, 4
| Value (X) : | 3 | 4 | 5 | 6 | 7 | 8 | 9 |
| Frequency (F): | 4 | 2 | 5 | 2 | 2 | 1 | 2 |
Thus , the mode = 5 since it occurs the maximum number of times.
(ii) 15, 8, 26, 25, 24, 15, 18, 20, 24, 15, 19, 15
| Value (X) : | 8 | 15 | 18 | 19 | 20 | 24 | 25 |
| Frequency (F): | 1 | 4 | 1 | 1 | 1 | 2 | 1 |
Thus, the mode = 15 since it occurs the maximum number of times.
19. The shirt size worn by a group of 200 persons, who bought the shirt from a store, are as follows. Find the model shirt size worn by the group?
| Shirt Size: | 37 | 38 | 39 | 40 | 41 | 42 | 43 | 44 |
| No of person: | 15 | 25 | 39 | 41 | 36 | 17 | 15 | 12 |
Solution:
| Shirt Size: | 37 | 38 | 39 | 40 | 41 | 42 | 43 | 44 |
| No of person: | 15 | 25 | 39 | 41 | 36 | 17 | 15 | 12 |
From the data its observed that, Model shirt size = 40 since it was the size which occurred for the maximum number of times.
20. Find the mode of the following distribution.
| Class Interval : | 25-30 | 30-35 | 35-40 | 40-45 | 45-50 | 50-55 |
| Frequency : | 25 | 34 | 50 | 42 | 38 | 14 |
Solution.
| Class Interval : | 25-30 | 30-35 | 35-40 | 40-45 | 45-50 | 50-55 |
| Frequency: | 25 | 34 | 50 | 42 | 38 | 14 |
It’s seen that the maximum frequency is 50. So, the corresponding class i.e., 35 – 40 is the modal class. And,
l = 35, h = 40 – 35 = 5, f = 50, f1 = 34, f2 = 42
So, we use the following formula:
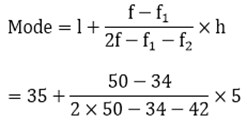
= 38.33